National Hunt (adventurous strategy)
The performance data presented below are based on all selections made according to our adventurous strategy. The jumps adventurous tip in our daily tips newsletter is one selection from these. More of these will have been visible at different times each day in the "live update" posts in the Daily Tips section.
Our performance data go back to February 2024 but we only show changes for the last year, for greater clarity.
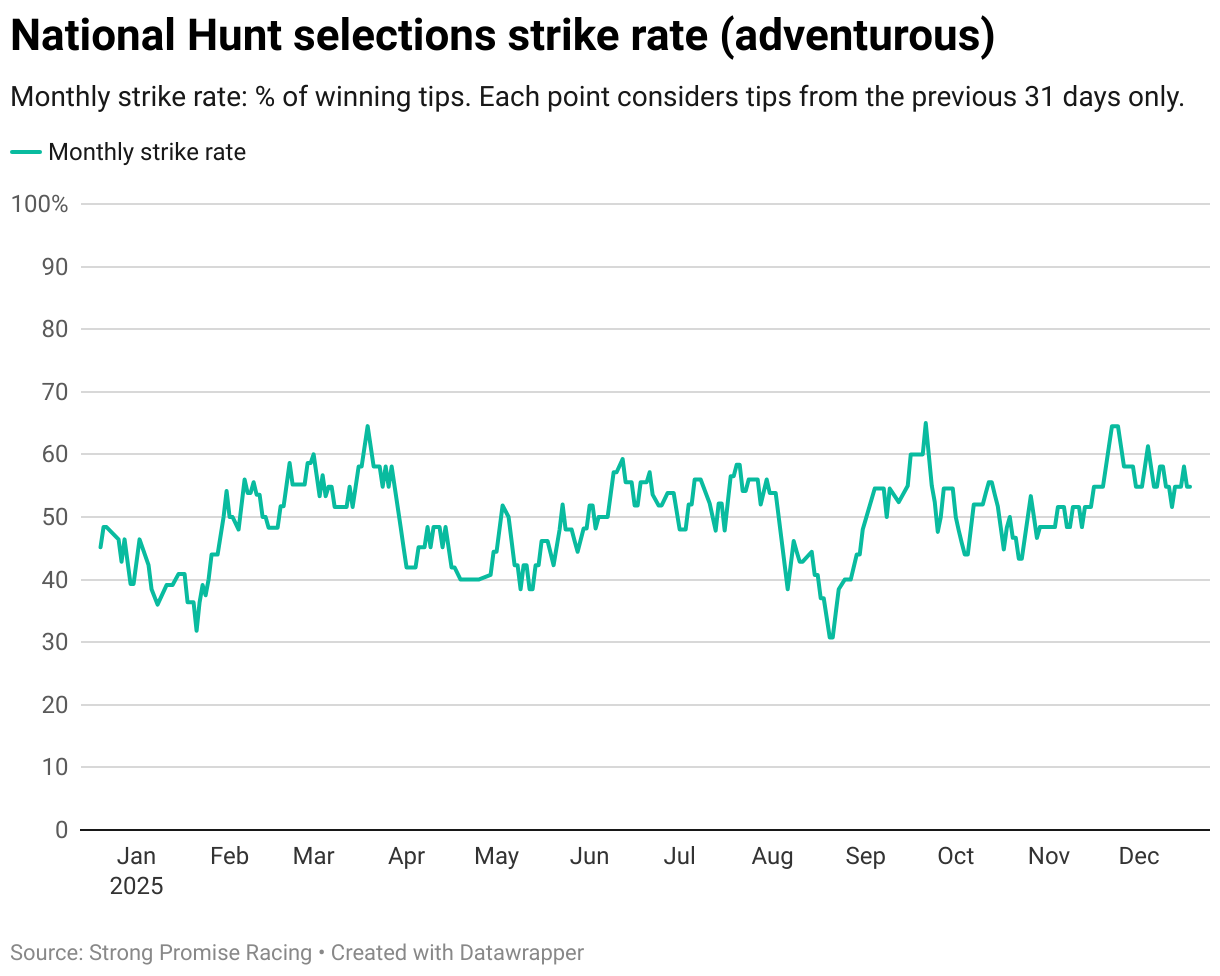
This is the monthly strike rate: what proportion of our tips are winners. This line changes over time because each point represents the strike rate of tips in the month up to the date indicated by the horizontal axis.
The rightmost point on the chart is the strike rate for the month leading up to now.
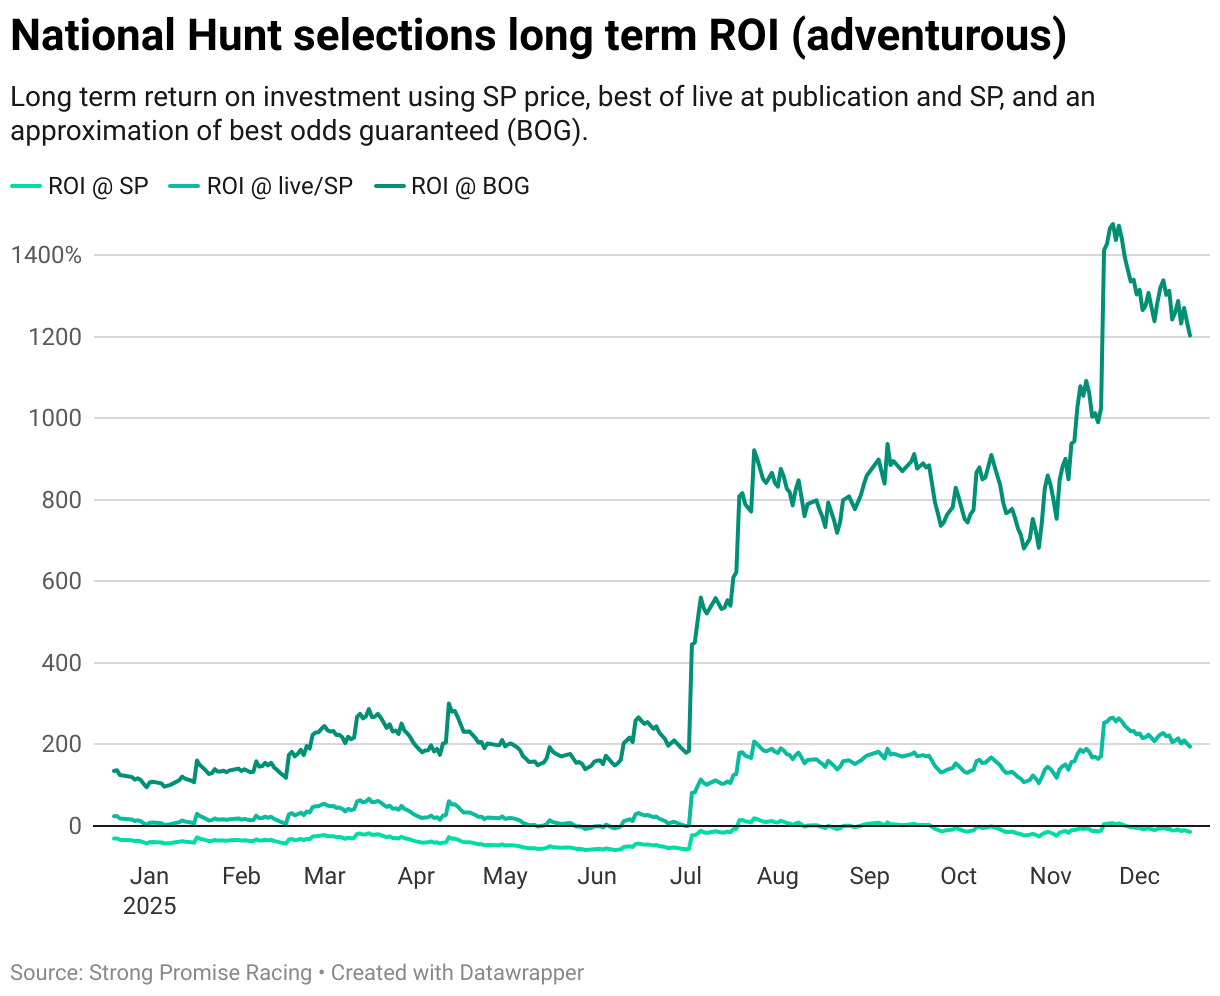
This is the long term return on investment. Imagine you start in February 2024 with £100 and stake 1% of your capital per point. After each bet, you update your capital with your winnings/losses. This chart shows how much your capital would have increased by over time, as a percentage of starting capital. For example, 100% means doubling your initial capital from February 2024.
The three lines represent different scenarios for what odds were taken for each bet. "SP" means the odds are SP odds, "live/SP" is the SP odds or the live odds stated in the tip, whichever was greater, and "BOG" is "live/SP" increased by 15%. "Live/SP" is a pessimistic approximation of what would have been achieved using best odds guaranteed service; "BOG" is an optimistic approximation. In reality, best odds guaranteed would give returns somewhere between these two.
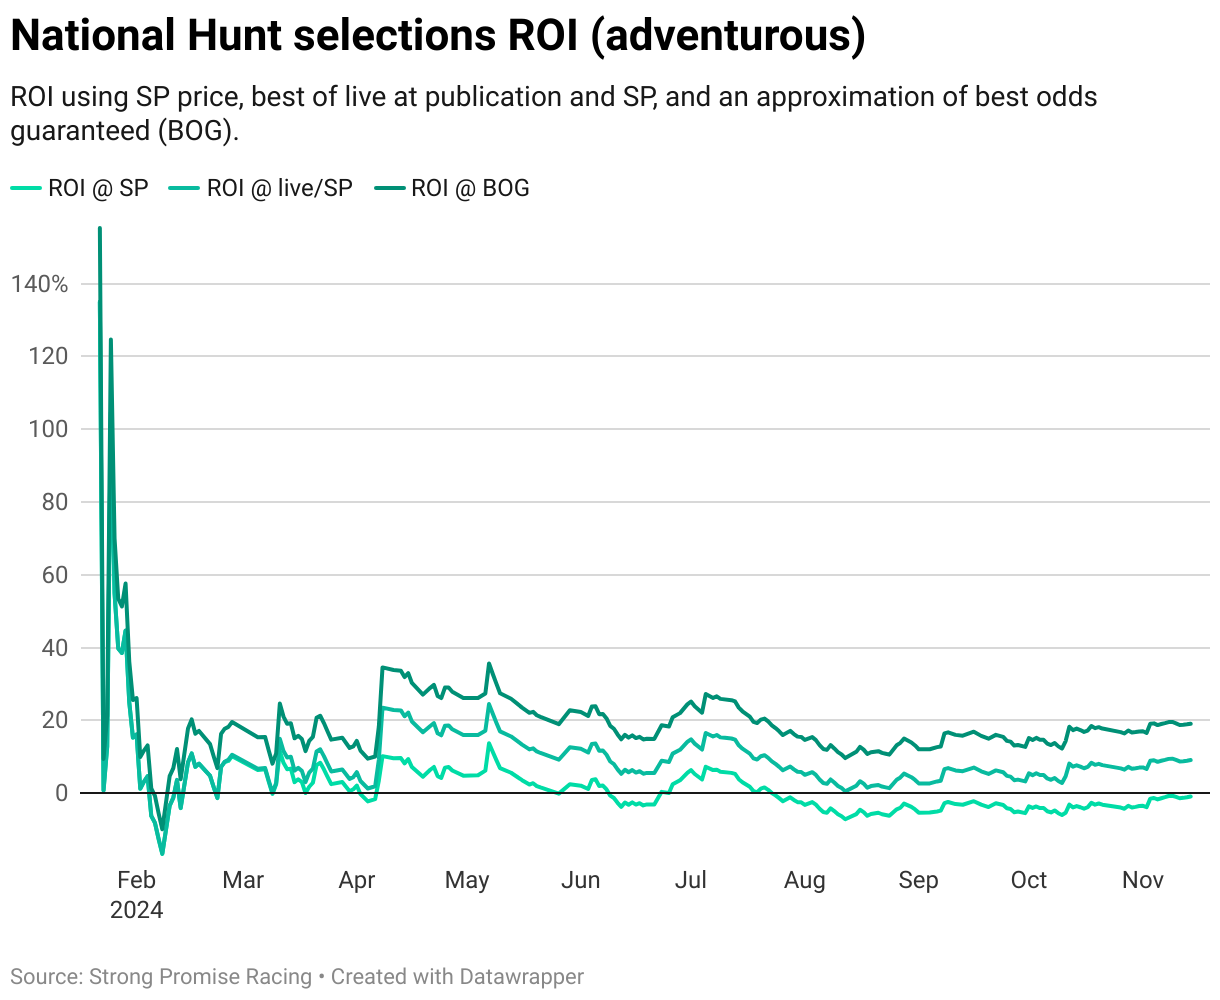
This is long term profitability. This is like return on investment, but with constant stakes. It shows the average profitability of all tips up to the time on the horizontal axis.
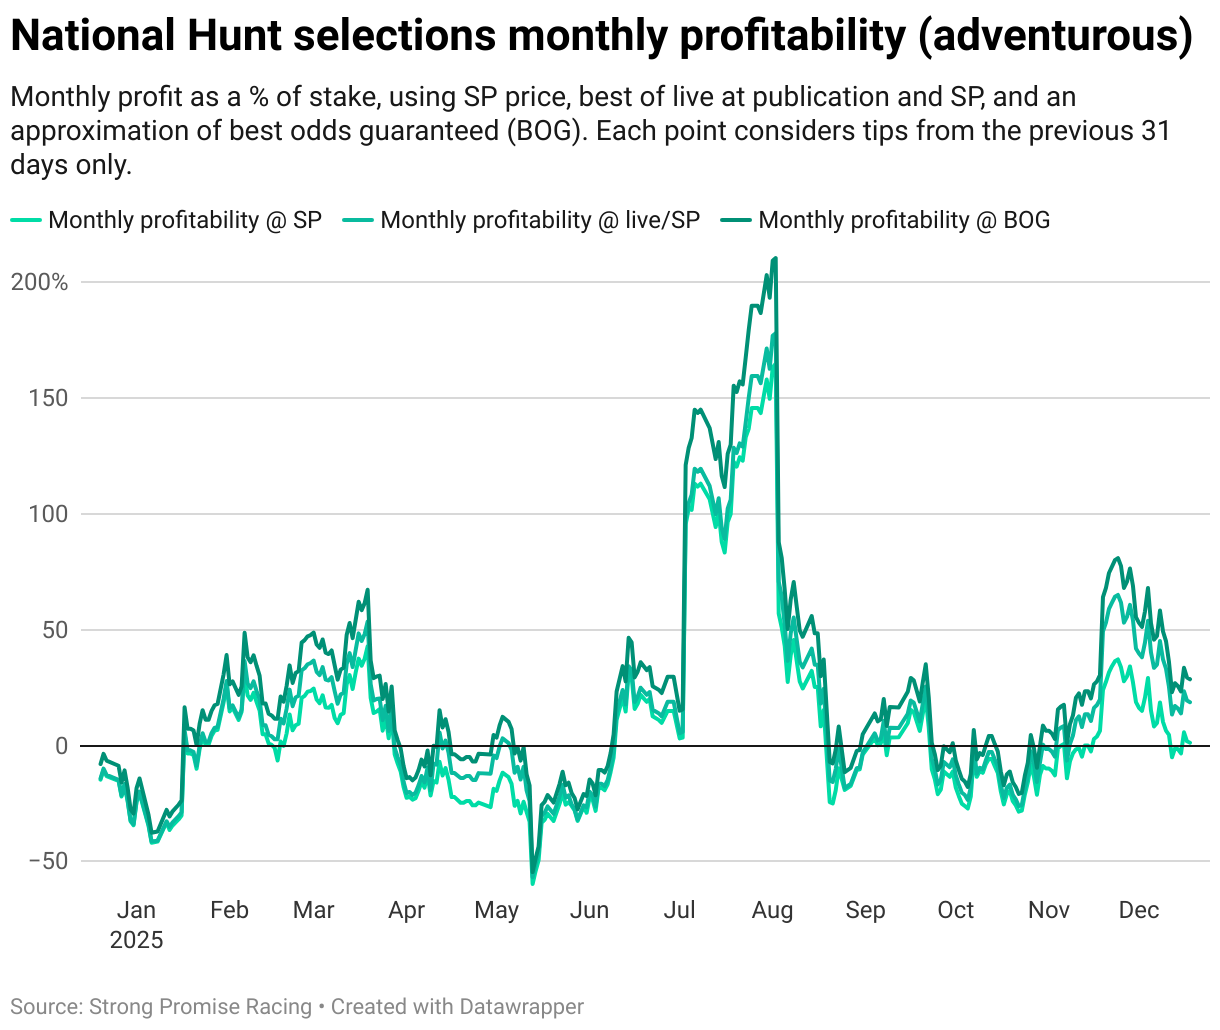
This also shows profitability, like in the previous chart, but restricted to the past month only, as in the strike rate chart.
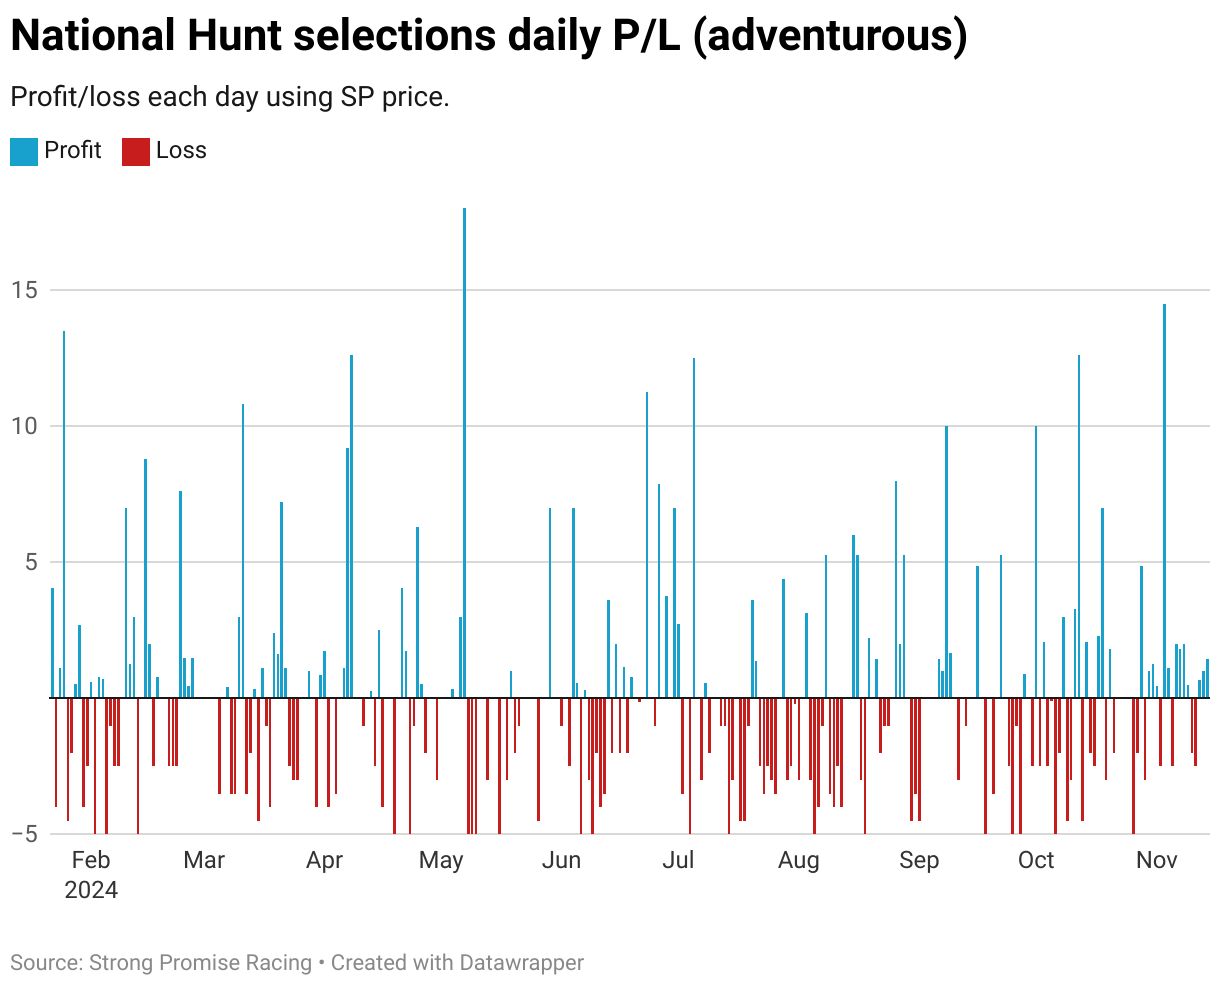
This chart shows the return of every bet, each day. Blue lines, above the horizontal axis, are profitable returns; red lines, below the axis, are losses.